Past perfomance is not indicative of future profits, but history is?
Another thought from John Mauldin's Frontline (http://www.frontlinethoughts.com/printarticle.asp?id=mwo111805), which could be titled " been up so long it looks like up so more to me", excerpts, comments, editing following.
"Based upon most forecasts of reported earnings from S&P 500 companies in 2006, the stock market is beginning to look attractive. Earnings per share ("EPS") have increased at double-digit growth rates over the past few years and are expected to tack on another strong leap in 2006. [A] valid estimate of future EPS is essential to develop a realistic view about future market direction and investment strategy.
The average nominal growth rate for EPS since 1950 is approximately 6% per year. Average rarely happens: There are significant cycles and volatile swings in earnings that average to a growth rate of 6%. For more than half of the past 55 years, EPS has changed--up or down--by more than 10%. Therefore, double-digit growth rates or declines are more often the rule than the exception. Rather than the relatively smooth growth rate that many investors expect, earnings grow for a few years at a pace that is well above the average and then slow or decline for a couple of years.
[C]orporate earnings tend to grow over time at a rate that is similar to gross domestic product ("GDP") growth. Yet the effects of business cycles and other economic factors cause earnings to be more volatile than the economy.
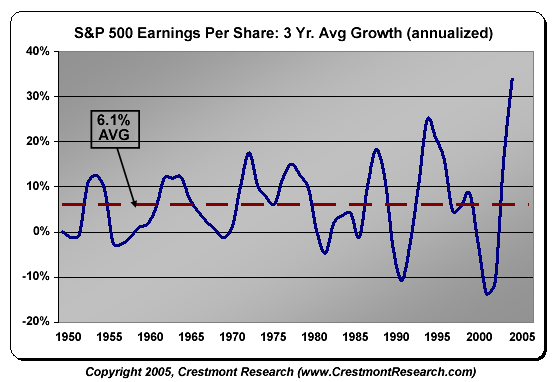
Currently, as reported in the Financial Times on October 22, 2005 in the lead editorial, "Corporate profits are already at a record 10.9 per cent of gross domestic product in the US...it is hard to see how earnings can continue to grow so much faster than gross domestic product." Not only is it hard to see how profit growth will extend its current record levels, but also it is instructive to look at history to understand what may lie ahead. Figure 2 presents the average annualized rate of EPS growth over rolling three-year periods. The graph indicates that EPS has risen so significantly in the past three years that it is vulnerable to a reversal and, potentially, to a series of below-average or negative periods.
Figure 2 Rolling 3-Year EPS Growth

At all times along the cycles, investors are bombarded with messages of hope from bull market pundits. In the troughs, the message calls for a recovery--a "wise" prediction that has played-out many times in the past. Each trough in Figure 2 is followed by a solid rise toward, and then above, the average trend line. However, at the peaks, the message from pundits is likewise hopeful--it's just not wise.
The hopeful, but unrealistic, messages lead investors to expect that the future growth will occur from then current levels. This is the same irrational reasoning that leads some investors to expect average future returns regardless of the level of the market....
In this article, we have explored two different methods using lessons of history [actually, you need to see the whole article for that; this is only an excerpt]. Both methods predict S&P 500 EPS near $64 in 2008. If overall stock market P/Es can be sustained in the low 20s--relatively high by historical standards--the stock market in 2008 will be near the same level that it is today.
Investors overreact to good news and underreact to bad news on stocks they like, and do just the opposite to stocks that are out of favor. Past perception seems to dictate future performance. And it takes time to change those perceptions.
This is forcefully borne out by a study produced in 2000 by David Dreman (one of the brightest lights in investment analysis) and Eric Lufkin. The work, entitled "Investor Overreaction: Evidence That Its Basis is Psychological," is a well-written analysis of investor behavior that illustrates that perceptions are more important than the fundamentals. Let's look at that study in detail.
In any given year, there are stocks that are in favor, as evidenced by high valuations and rising prices. There are also stocks that are just the opposite. Dreman and Lufkin look at a database for 4,721 companies from 1973 through 1998. Each year, they divide the database up into five parts, or quintiles, based on the companies' perceived market valuations. They separately study price to book value (P/BV), price to cash flow (P/CF), and the traditional price to earnings (P/E). This creates three separate ways to analyze stocks by value for any given year so as to remove the bias that might occur from using just one measure of valuation.
The top and bottom quintiles become stock investment "portfolios" for all three valuation measures [they aren't interested in the 3 middle quintiles]. You might think of them as a mutual fund created to buy just these stocks. There is enough data to create 85 such portfolios or funds. The researchers then look 10 years back and five years forward for these portfolios. They first analyze these portfolios as to how they do relative to the average of all the stocks. They then analyze these portfolios in terms of five basic investment fundamentals: cash flow growth, sales growth, earnings growth, return on equity and profit margin. They do this latter test to see if you can discern a fundamental reason for the price action of the stock.
[I]nvestors tend to chase price performance [not fundamentals]. In fact, the higher the price and more rapid the movement, the more new investors there are who jump in [without due regard to the fundamentals]. Why does this "chasing the hot stock" happen? Dreman and Lufkin tell us it is because investors become overconfident that the trends of the fundamentals in the first 10 years will repeat forever, "thereby carrying the prices of stocks that appear to have the 'best' and 'worst' prospects. Investors are likely to forecast a future not very different from the recent past, i.e., continuing improving fundamentals for favorites and deteriorating fundamentals for out-of-favor issues. Such forecasts result in favorites being overpriced, while out-of-favor issues are priced at a substantial discount to the real worth. The extrapolation of past results well into the future and the high confidence in the precise forecast is one of the most common errors made in finance."
[T]he fundamentals improve quite steadily for the first 10 years for the favorite stocks in comparison to the entire universe of stocks. But the price performance rises at very high rates, far faster than the fundamentals, particularly in the latter years. It clearly accelerates. It seems the longer a stock does well, the more confident investors are that it will continue to do well and therefore they award it with higher and higher multiples. The exact opposite is true of the out-of-favor stocks.
Yet in the next five years, the hot stocks underperformed the market by -26 percent on a P/BV basis and -30 percent on a P/CF basis. The out-of-favor stocks did 33 percent and 22 percent better than the market, respectively. This is a huge reversal of trend.
What happened? Did the trends stop? Did the former outcasts finally get their act together and start to show better fundamentals than the allstars? The answer is a very curious "no." Dreman and Lufkin find that "there is no reversal in fundamentals to match the reversal in returns [price]. That is, as favored stocks go from outperforming the market, their fundamentals do not deteriorate significantly; in some case they actually improve. . . . The fundamentals of the 'worst' stocks are weaker than both those of the market and of the 'best' stocks in both periods. Although there is a major reversal in the returns [prices] to the best and worst stocks, there is no corresponding reversal in the fundamentals."
If we do not get a serious recession, it may take two recessions to bring us to the final phase of this secular bear market. That would not be unusual, as cycles average about 13 years (8 being the shortest, 17 the longest), and we are only in the fifth year of this current cycle. Nonetheless, the next recession is going to give us an excellent buying opportunity. But right now, caution should be exercised. In the coming weeks (after I finish the current series), I will be writing about a number of indicators that suggest 2006 may see a real slowdown in the US economy. Stay tuned."
Might recall: http://guambatstew.blogspot.com/2005/08/back-handed-compliment.html
My mate in the options market keeps up a good commentary on following the price action, since Mauldin seems to say that is what counts most - in the short term, anyway. See http://www.egoli.com.au/egoli/egoliToKnightsBulletin.asp
"Based upon most forecasts of reported earnings from S&P 500 companies in 2006, the stock market is beginning to look attractive. Earnings per share ("EPS") have increased at double-digit growth rates over the past few years and are expected to tack on another strong leap in 2006. [A] valid estimate of future EPS is essential to develop a realistic view about future market direction and investment strategy.
The average nominal growth rate for EPS since 1950 is approximately 6% per year. Average rarely happens: There are significant cycles and volatile swings in earnings that average to a growth rate of 6%. For more than half of the past 55 years, EPS has changed--up or down--by more than 10%. Therefore, double-digit growth rates or declines are more often the rule than the exception. Rather than the relatively smooth growth rate that many investors expect, earnings grow for a few years at a pace that is well above the average and then slow or decline for a couple of years.
[C]orporate earnings tend to grow over time at a rate that is similar to gross domestic product ("GDP") growth. Yet the effects of business cycles and other economic factors cause earnings to be more volatile than the economy.
Currently, as reported in the Financial Times on October 22, 2005 in the lead editorial, "Corporate profits are already at a record 10.9 per cent of gross domestic product in the US...it is hard to see how earnings can continue to grow so much faster than gross domestic product." Not only is it hard to see how profit growth will extend its current record levels, but also it is instructive to look at history to understand what may lie ahead. Figure 2 presents the average annualized rate of EPS growth over rolling three-year periods. The graph indicates that EPS has risen so significantly in the past three years that it is vulnerable to a reversal and, potentially, to a series of below-average or negative periods.
Figure 2 Rolling 3-Year EPS Growth
At all times along the cycles, investors are bombarded with messages of hope from bull market pundits. In the troughs, the message calls for a recovery--a "wise" prediction that has played-out many times in the past. Each trough in Figure 2 is followed by a solid rise toward, and then above, the average trend line. However, at the peaks, the message from pundits is likewise hopeful--it's just not wise.
The hopeful, but unrealistic, messages lead investors to expect that the future growth will occur from then current levels. This is the same irrational reasoning that leads some investors to expect average future returns regardless of the level of the market....
In this article, we have explored two different methods using lessons of history [actually, you need to see the whole article for that; this is only an excerpt]. Both methods predict S&P 500 EPS near $64 in 2008. If overall stock market P/Es can be sustained in the low 20s--relatively high by historical standards--the stock market in 2008 will be near the same level that it is today.
Investors overreact to good news and underreact to bad news on stocks they like, and do just the opposite to stocks that are out of favor. Past perception seems to dictate future performance. And it takes time to change those perceptions.
This is forcefully borne out by a study produced in 2000 by David Dreman (one of the brightest lights in investment analysis) and Eric Lufkin. The work, entitled "Investor Overreaction: Evidence That Its Basis is Psychological," is a well-written analysis of investor behavior that illustrates that perceptions are more important than the fundamentals. Let's look at that study in detail.
In any given year, there are stocks that are in favor, as evidenced by high valuations and rising prices. There are also stocks that are just the opposite. Dreman and Lufkin look at a database for 4,721 companies from 1973 through 1998. Each year, they divide the database up into five parts, or quintiles, based on the companies' perceived market valuations. They separately study price to book value (P/BV), price to cash flow (P/CF), and the traditional price to earnings (P/E). This creates three separate ways to analyze stocks by value for any given year so as to remove the bias that might occur from using just one measure of valuation.
The top and bottom quintiles become stock investment "portfolios" for all three valuation measures [they aren't interested in the 3 middle quintiles]. You might think of them as a mutual fund created to buy just these stocks. There is enough data to create 85 such portfolios or funds. The researchers then look 10 years back and five years forward for these portfolios. They first analyze these portfolios as to how they do relative to the average of all the stocks. They then analyze these portfolios in terms of five basic investment fundamentals: cash flow growth, sales growth, earnings growth, return on equity and profit margin. They do this latter test to see if you can discern a fundamental reason for the price action of the stock.
[I]nvestors tend to chase price performance [not fundamentals]. In fact, the higher the price and more rapid the movement, the more new investors there are who jump in [without due regard to the fundamentals]. Why does this "chasing the hot stock" happen? Dreman and Lufkin tell us it is because investors become overconfident that the trends of the fundamentals in the first 10 years will repeat forever, "thereby carrying the prices of stocks that appear to have the 'best' and 'worst' prospects. Investors are likely to forecast a future not very different from the recent past, i.e., continuing improving fundamentals for favorites and deteriorating fundamentals for out-of-favor issues. Such forecasts result in favorites being overpriced, while out-of-favor issues are priced at a substantial discount to the real worth. The extrapolation of past results well into the future and the high confidence in the precise forecast is one of the most common errors made in finance."
[T]he fundamentals improve quite steadily for the first 10 years for the favorite stocks in comparison to the entire universe of stocks. But the price performance rises at very high rates, far faster than the fundamentals, particularly in the latter years. It clearly accelerates. It seems the longer a stock does well, the more confident investors are that it will continue to do well and therefore they award it with higher and higher multiples. The exact opposite is true of the out-of-favor stocks.
Yet in the next five years, the hot stocks underperformed the market by -26 percent on a P/BV basis and -30 percent on a P/CF basis. The out-of-favor stocks did 33 percent and 22 percent better than the market, respectively. This is a huge reversal of trend.
What happened? Did the trends stop? Did the former outcasts finally get their act together and start to show better fundamentals than the allstars? The answer is a very curious "no." Dreman and Lufkin find that "there is no reversal in fundamentals to match the reversal in returns [price]. That is, as favored stocks go from outperforming the market, their fundamentals do not deteriorate significantly; in some case they actually improve. . . . The fundamentals of the 'worst' stocks are weaker than both those of the market and of the 'best' stocks in both periods. Although there is a major reversal in the returns [prices] to the best and worst stocks, there is no corresponding reversal in the fundamentals."
If we do not get a serious recession, it may take two recessions to bring us to the final phase of this secular bear market. That would not be unusual, as cycles average about 13 years (8 being the shortest, 17 the longest), and we are only in the fifth year of this current cycle. Nonetheless, the next recession is going to give us an excellent buying opportunity. But right now, caution should be exercised. In the coming weeks (after I finish the current series), I will be writing about a number of indicators that suggest 2006 may see a real slowdown in the US economy. Stay tuned."
Might recall: http://guambatstew.blogspot.com/2005/08/back-handed-compliment.html
My mate in the options market keeps up a good commentary on following the price action, since Mauldin seems to say that is what counts most - in the short term, anyway. See http://www.egoli.com.au/egoli/egoliToKnightsBulletin.asp
posted by Guambat Stew at Monday, November 21, 2005
![]()
![]()


0 Comments:
Post a Comment
<< Home