Sawing logs
Look at the picture of the Sydney Share Price Index, going back roughly 22 years. Look at the left side and then the right side. The left side rises dramatically and then collapses in the "Crash of 1987". The right side rises dramatically and then, what?: keeps on rising dramatically?
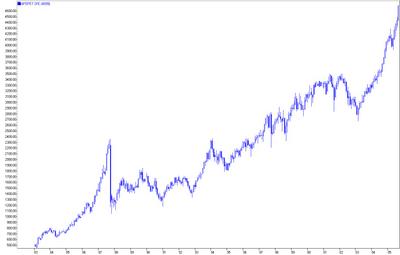
Well, maybe. But not likely. That kind of exponential action has a way of burning out when you least expect it; regardless of whether you expect it or not. It's always a timing thing, and most people will be either too soon or too late to the party. I'm too soon, evidently, again; I always tend to hit to left field.
Putting some numbers on it, the SPI corrected from 3500 down to 2700, which it briefly pierced in March 2003. Today the SPI got to 2000 points above that low, at 4700. Recognise that the SPI is simply a derivative of the broad stock index, currently the S&PASX200, but until only a few years ago, the All Ordinaries Index. You can see a chart of the All Ords going back to 1900 from 2003 here: http://www.asx.com.au/about/pdf/all_ords.pdf
What you find is the All Ords went from effectively zero to 2700 in the 103 years shown on that chart. Then in the next 30 months it increased its value by almost another 75% (2700 x 1.74% = 4700 +/-). If the market had grown at that rate (1.75% per 30 months compounded), assuming it started at 1 (one), it would have taken a little over 40 years to reach its current level, not 105 years. The point being, it didn't, and that any such sustained rate of growth is highly fanciful.
There are those who say you can't look at the shape and extent of the current rise off 2700 to 4700 and compare it to 1987, unless you use a log scale comparison, which compares moves by their percentage gain, not their lineal, nominal gain. (Fair enough, but the percentage relationship of expecting 1.74% gain every 30 months has already shown to be pretty fantastic.)
But accepting that challenge, I've already produced that chart. See http://guambatstew.blogspot.com/2005/09/channeling-spi.html That was way back 10 days ago, on September 20, when the SPI was about 4580. See the top line of the channel going back to the '87 drop? That line has not been broken except for the rise into the '87 crash -- until now. That puts it in pretty treacherous territory.
But, it is not just territory that characterises the technical status of stocks. There is also a not very well defined concept of time. I don't have a clue what Gann was all about, but I think he did pretty solidly establish the notion that, like grieving, there is a respectable amount of time that prices (and widows) "should" stay in a range before moving on. It is the galloping and accellerating pace of this recent ascent that makes it dizzying, not simply the heights reached (or to be reached).
But don't pay any attention to my rants. I'm only talking my book. I'm not really good at technical analysis or maths. You really wouldn't want my track record in the market. And I need to do this for therapy.
There goes another of those darned pink elephants. Did anyone mention the '87 crash took place in October? Shoosh. There he goes again. Can't you control him?
Labels: Bubblicious, Markets, Trading
posted by Guambat Stew at Friday, September 30, 2005
![]()
![]()


2 Comments:
I notice you've written somewhere in the vicinity of 5 articles today!!
get a job!
You bet on an October crash and lost again? How did you lean toward this racket anyway?
Post a Comment
<< Home